All Posts By

Célia Martinez

Master your microbial issues in the paper industry

As a significant water consumer, the paper industry has adapted by reusing its industrial water. Yet, it still faces significant microbiological challenges leading to various direct and indirect consequences. These include the quality of the final product, microbial safety, environmental concerns, staff well-being…
How can the paper industry address these problems, and what solutions are available?

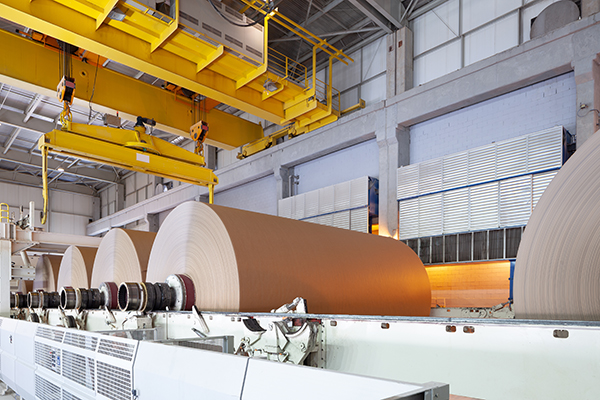
Microbiological Challenges in the Paper Industry

The paper industry’s water demand is substantial, estimated at 500 liters per kilogram of paper produced [1]. To address environmental concerns related to resource scarcity and better manage their effluents, the industry has adapted by recycling 95% to 98% of water used internally [2]. However, the closed-loop systems have intensified microbiological issues.

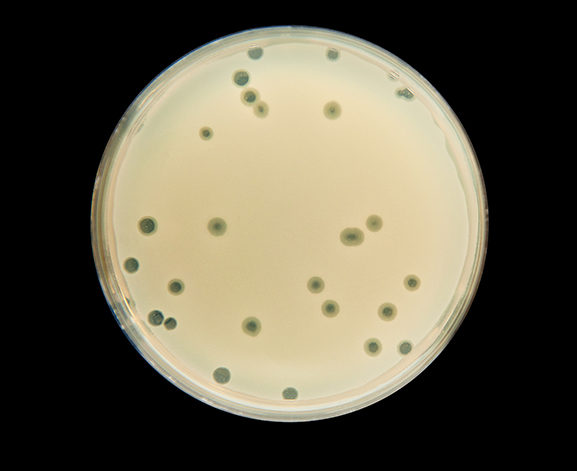
Indeed, microorganisms such as bacteria, yeast, and fungi find an ideal environment for rapid growth within the paper production process. Various factors, including abundant nutrients, suspended solids (MES), temperatures ranging from 30 to 60°C, and a neutral pH level (6.5 to 7.5), provide favorable conditions for microbial development.

When microorganisms grow uncontrollably, they form biofilms (slime) that adhere to machinery surfaces. This biofilm accumulation can lead to several detrimental effects:

  • Weakened paper sheets causing breaks: the biofilm deposited on the paper web during the drying process creates holes, reducing paper strength and resulting in costly downtime. 
  • Unwanted discoloration or staining of the paper: different microorganisms present can cause grey, yellow, or orange stains, diminishing the product’s value and even rendering it unsellable.
  • Unpleasant odors: microorganisms produce foul-smelling gases, leading to workplace discomfort, health issues, and neighborhood complaints.
  • Microbiological corrosion: development of corrosive bacteria, like sulfite-reducing bacteria, damages networks, leading to significant maintenance costs.


Existing Curative Solutions 

To prevent or address these issues, paper industry operators resort to heavy treatments that have significant environmental implications. The two main curative actions are:

  • Circuit cleaning using biodispersant products, followed by total network drainage.
  • Disinfection with biocidal products, which can be harmful to the environment.

However, these methods come with consequences:

Curative actions Consequences
Cleaning Filamentous bacteria discharge in wastewater treatment plants
An excessive growth of filamentous bacteria leads to bulking phenomena, affecting sludge settling. This degrades the quality of the discharged effluent.
Biodispersants discharge in wastewater treatment plants
In large quantities, these products are difficult to eliminate and/or neutralize. Their release into the natural environment can cause environmental problems.
Disinfection Biocide discharge in wastewater treatment plants
Biocidal substances are challenging to eliminate completely, resulting in their release into the natural environment, causing environmental issues.
Residues in mists enveloping the machine

A health risk (Legionellosis) for employees working in the manufacturing facility.

Significant economic cost in biocide products for the company


Mastering Product Treatment Usage is Achievable!

While product treatment remains essential for ensuring high-quality production and safety, controlling the quantity of used products is necessary to limit toxic agent discharge into the environment.

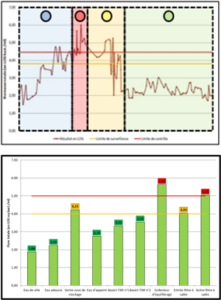
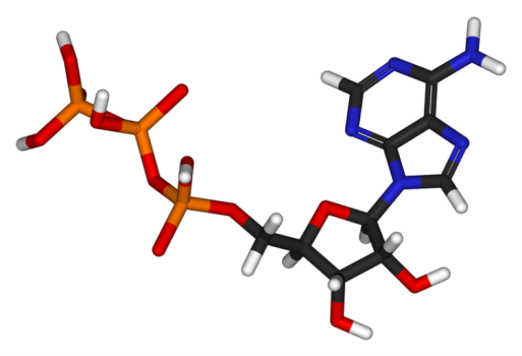
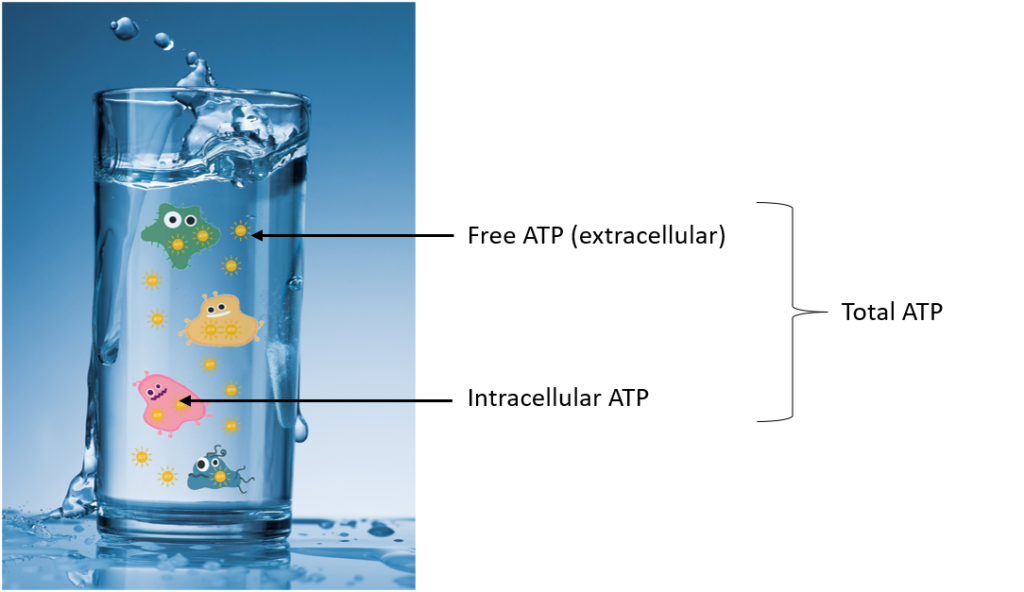
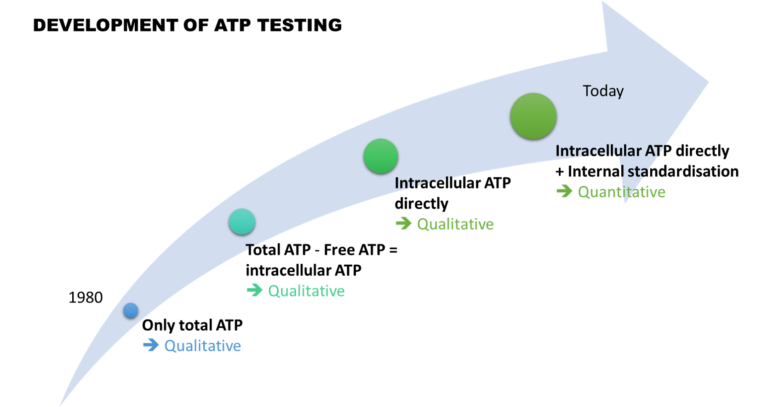
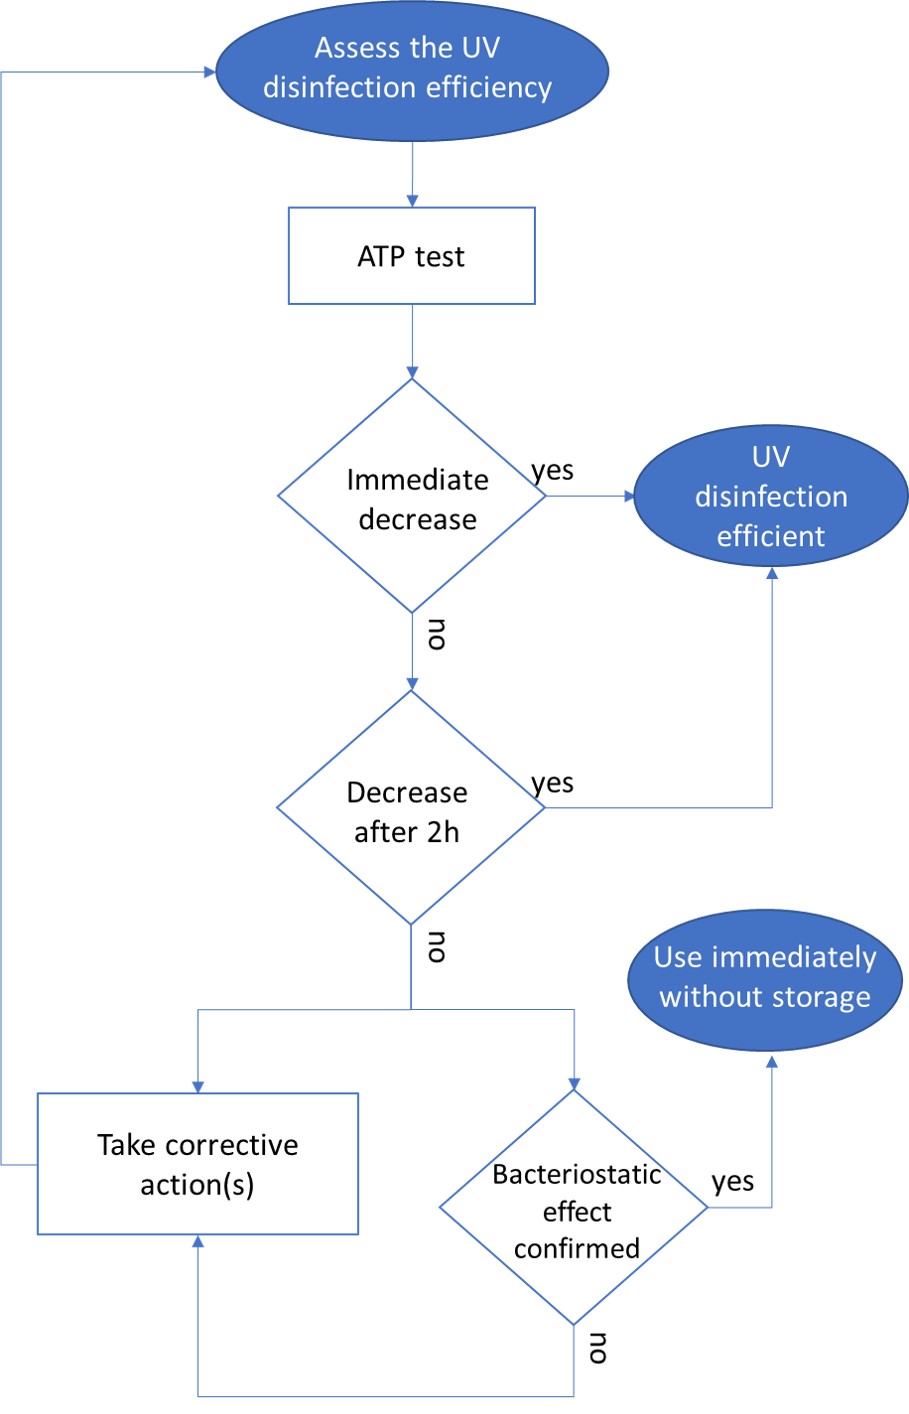
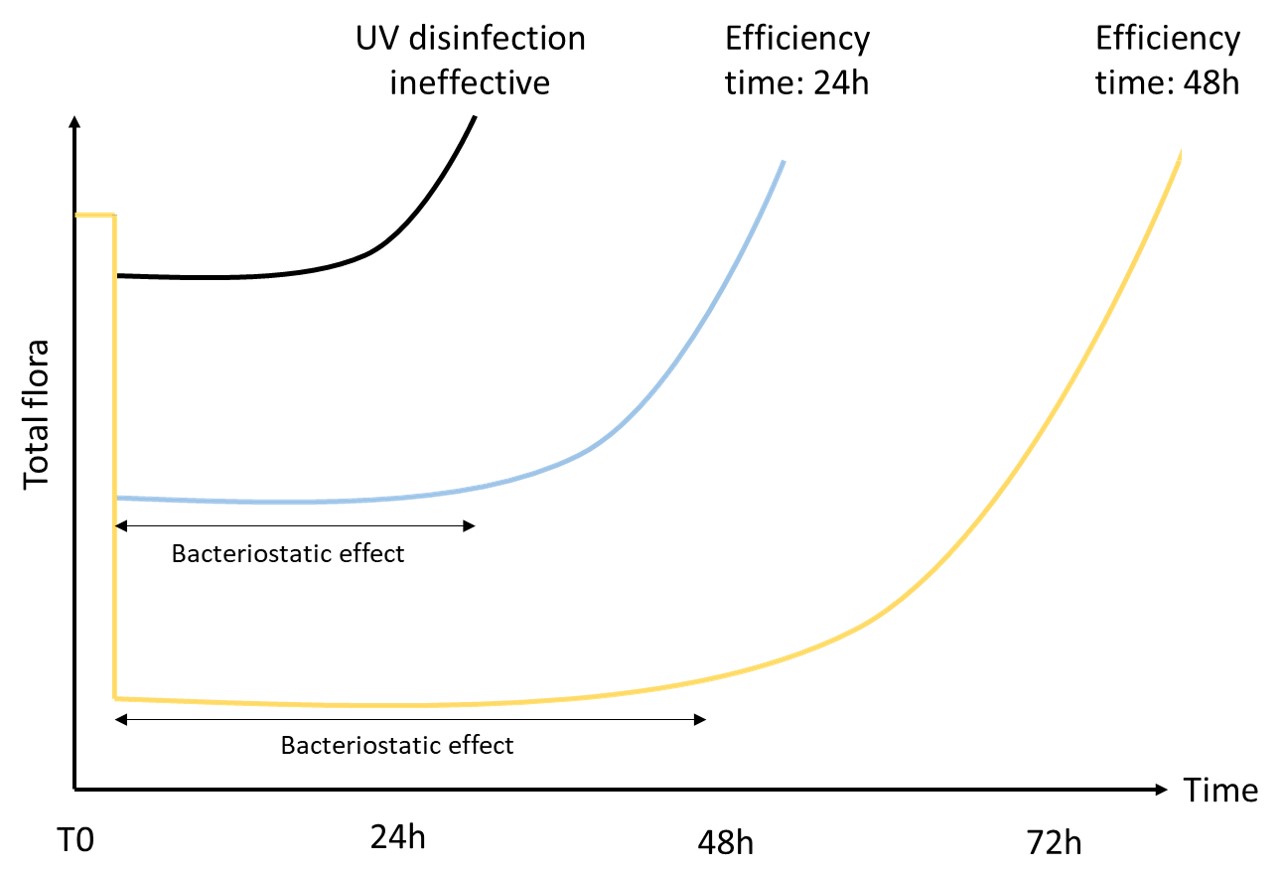
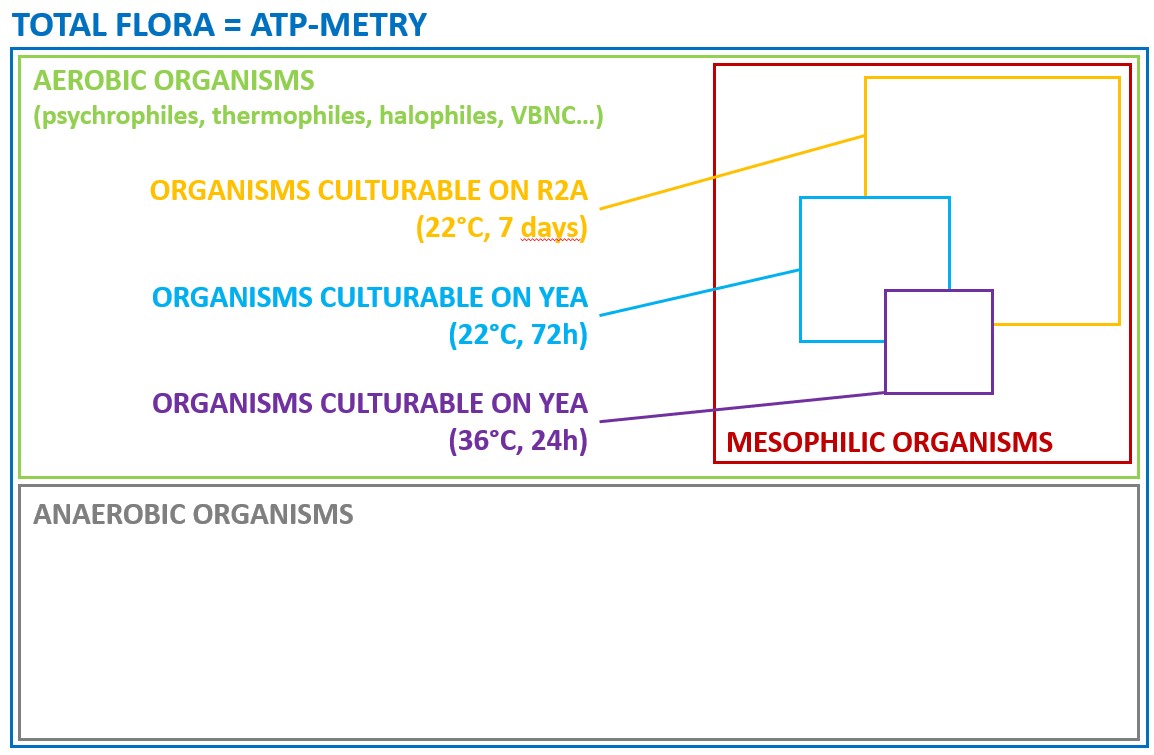
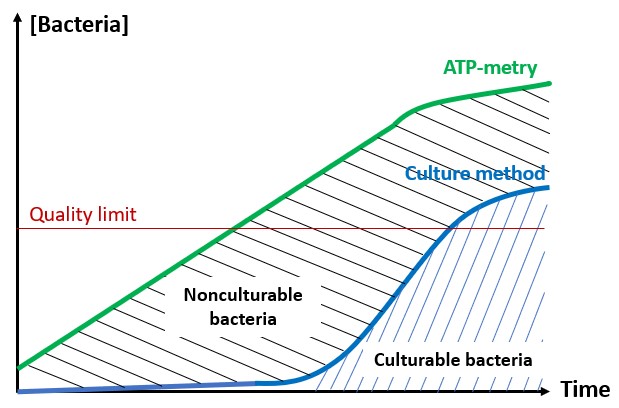
One solution to reduce product usage is to prevent biofilm development proactively. Regularly monitoring the water network allows operators to anticipate microbiological issues, biofilm accumulation, and subsequent product contamination. In this regard, having a total flora indicator is essential. Quantitative ATP-metry provides on-site results in just 2 minutes, indicating the overall microbiological load of water. This enables operators to take action before defects appear in the final product.

ATP tests offer several advantages, including:

  • Identifying process elements that are sources of contamination or microbial growth, facilitating targeted antimicrobial treatments.
  • Evaluating the effectiveness of existing biocidal treatments.
  • Improving treatment efficiency through better selection of active molecules, injection points, and frequencies.
  • Anticipating potential microbiological issues.

ATP tests thus provide numerous benefits:

  • Reduced production defects.
  • Decreased installation downtime.
  • Limited use of environmentally harmful products, promoting eco-responsible management of biocidal and biodispersant products – use only what is necessary!
  • Cost savings on treatment products.

In conclusion, by employing advanced techniques such as ATP-metry, the paper industry can overcome its microbiological challenges more effectively, ensuring high-quality production while maintaining a sustainable approach to environmental and economic factors.

FREE ATP VS INTRACELLULAR ATP

What is ATP?

Adenosine triphosphate (ATP) is a molecule used by all living cells to provide energy to metabolic reactions. It is often referred to as the “molecular unit of currency” of intracellular energy transfer. As ATP is specific to living environments, its presence proves the existence of living organisms.
ATP testing is a technique measuring the level of ATP in a sample in just a few minutes.
There are two forms:

  • Free or extracellular ATP,
  • Intracellular ATP.
Molécule ATP
Free ATP

It is the ATP freed by the dying or dead cells. When a cell dies, it loses its membrane integrity. The ATP, which is a very small molecule, is released in the environment.

As it is an unstable molecule in unbuffered water, it is rapidly destroyed. Its stability depends on many parameters:

  • pH: free ATP is stable at neutral pH but its degradation rate quickly increases with alkaline and acidic pH.
  • Temperature: degradation rate increases with temperature. Rather stable at 4°C, it degrades quickly at 25-30°C.
  • Presence of stabilisers: such as polycations and/or some cations.
  • Type of biocide used: oxidising biocides such as chlorine or bromine rapidly degrades free ATP whereas non oxidising biocides have little effect.
  • Presence of other microorganisms: some are able to retrieve free ATP to use it.

Therefore, free ATP stability is difficult to assess because it depends on many parameters. Indeed, if the environment provides a good stability, free ATP will accumulate. However, if the environment is unfavorable, free ATP will disappear very quickly.

Intracellular ATP

It is the ATP found in the living cells. As mentioned above, this molecule plays a vital role in intracellular energy transfer. It is permanently renewed and recycled in the cell, but its production immediately stops when the cell dies.

Total ATP is defined as the sum of free ATP and intracellular ATP. To measure it, it is necessary to destroy the cells with a lysis buffer in order extract the ATP. The measurement is done on the freed intracellular ATP and the free ATP.

To assess the quantity of microorganisms in a sample, only intracellular ATP must be measured.

Total ATP – free ATP = intracellular ATP

A short-sighted and risky approach…

How to measure intracellular ATP?

To quantify intracellular ATP, two different approaches have been developed: an indirect measurement and a direct measurement.

The indirect measurement:

It was the first technique to be developed. It is based on the assumption:

Total ATP – free ATP = intracellular ATP

Intracellular ATP is deduced from the measurement of total and free ATP.

  • Measurement of free ATP: it is measured by bioluminescence without lysis buffer. Thus, only extracellular (free) ATP is able to react with the bioluminescence enzyme. However, as described above, the quantity of free ATP varies greatly depending on many factors. It is not reprensentative of the quantity of microorganisms in the sample. Therefore, the measurement uncertainty is high.
  • Measurement of total ATP: it is measured by bioluminescence with lysis buffer that destroys the cells. Intracellular ATP is freed and add up to the free ATP. As the volumes of sample are generally low (around 100 µl), the presence of biofilm fragments strongly affects the result.

Consequently, using this strategy, the measurement of intracellular ATP is based on the subtraction of two uncertain measurements, which gives an approximate or even a false result.

The other problem lies in the fact that ATP measurement is relative. Indeed, the result is given in Relative Light Unit by the luminometer (RLU). Yet, in this indirect approach, the measurement is not standardised. It depends on many parameters affecting the enzyme efficacy (temperature, effect of lysis buffer, biocides…).

Working on qualitative measurements only leads to important approximations. It is even possible to get higher quantity of free ATP than total ATP!

In conclusion, the measurement of intracellular ATP by this approach is quick and easy. However, given the issues described above, the result can be bias and thus difficult to interpret. Therefore, it is essential to cautiously process the data to avoid over-interpretations.

Direct measurement of intracellular ATP

An extra step is required to measure intracellular ATP directly: filtration on a membrane to eliminate the free ATP. Indeed, as this molecule is very small, it passes through the membrane whereas the microorganisms are retained.

In this approach, the microorganisms retained on the filter are then destroyed in order to free the intracellular ATP. It gives a representative view of the living organisms in the sample.

Besides, this strategy has the advantage of analysing a representative volume of sample (generally between 10 and 50 ml).

Although requiring a little more handling, this approach, combined with standardisation, gives quantitative results much more reliable and comparable in time and space.

Conclusion

ATP testing is one of the fastest and easiest methods to detect microorganisms in water. This 40-year-old analysis has obviously evolved over time.

At first, only total ATP was detected qualitatively. Then, thanks to the measurement of free ATP, it was possible to indirectly assess the quantity of intracellular ATP. However, due to high variability, the result interpretation remained complicated.

Then, 15 years ago, new approaches emerged. They now include a filtration step to overcome the problems of variability.

Finally, the integration of external and then internal standardisation made this analysis quantitative. It became robust and comparable in time and space, making ATP testing a relevant analysis.

HOW TO PROPERLY COMPARE ATP TESTING AND CULTURE?

ATP testing and bacterial culture on solid agar plates are two completely different techniques. While culture method only measures culturable bacteria, i.e., the ones able to grow on a given media, ATP testing measures the quantity of ATP in a sample. As this molecule is produced and found in all living bacteria, ATP testing measures all the bacteria, culturable or not. This major difference makes them difficult to compare. 

However, when validating a new technique, it is natural to compare it with the conventional method. To avoid bias in result interpretation, here are some general tips.

General tips, not limited to these two techniques


  • Be aware of what each technique measures: ATP test measures the ATP and thus indirectly the total bacteria, while culture only measures culturable bacteria.
    .
  • Each technology has its own limits. ATP test uses a defined convention to estimate the number of bacteria in the sample (1 pgATP ≈ 1 000 bacteria). As for the culture method, it does not count the VBNC (Viable But Nonculturable) bacteria. Yet, according to literature, only 0.01 to 1% of bacteria grow on HPC media. Bacterial culture is limited by the choice of culture media, of incubation time and incubation temperature.
    .
  • It is necessary to work on a large concentration range, i.e., on several LOG.
    .
  • Perform each measurement at least in triplicate to obtain a significative value for each method.
    .
  • All the samples must be treated in the same way, whatever the analysis method. One of the most frequent mistakes is to collect the sample in a bottle with sodium thiosulfate for culture analysis and without sodium thiosulfate for ATP analysis. In the first case, the biocide action will be stopped, while in the second case, the biocide will keep its action, eliminating the biomass. The comparison would then be distorted. Therefore, it is essential to perform the analyses on the same sampling bottle. Likewise, if a dilution is necessary, it must be diluted in sterile water or physiological serum for both methods.
    .
  • Last but not least: it is primordial to look at the results with a critical eye. You should be able to identify outlying results.

Specific tips on ATP tests vs Culture comparison

On top of the previous tips, here are some advice specific to these two technologies:

  • Liquid culture media bias ATP results. Indeed, there is a large amount of free ATP and inhibitors in culture media. To avoid misleading results, dilute the samples in water or rinse the filter membrane.
    .
  • Bacteria cultures are not representative of the actual sample. As those bacteria are prepared for growth on culture media, a large part of them will grow and form colonies, whereas we know that only 0.01 to 1% of environmental bacteria are able to grow on culture media. Thus, it is important to compare the methods on real samples with complex ecosystems.
    .
  • Even if ATP test has a very high sensitivity, it cannot demonstrate sterility.

ARTICLES AVAILABLE ONLINE

Several quantitative ATP tests vs culture comparisons have been published over the last few years:

HOW TO ASSESS THE EFFICACY OF UV DISINFECTION USING ATP TESTING?

UV disinfection

How does it work?

Nowadays, UV disinfection is commonly used for drinking water treatment. UV radiations alter nucleic acids (DNA and RNA) of most cells such as bacteria, viruses or protozoans. They damage the genetic material of microorganisms preventing them from replicating or ensuring part of their metabolic functions. UV radiations inactivate microorganisms.

Depending on the type of microorganism and its physiological state, the inactivation will have:

  • a bactericidal effect leading to the death of the cell. Indeed, if the UV dose is high enough, radiations will alter the membrane integrity and lead to the immediate destruction of the cell.
  • a bacteriostatic effect which will momentarily stop the growth and development of the cell. However, microorganisms have the ability to repair UV-induced damage and restore infectivity.

UV doses

The UV doses required to permanently inactivate a cell vary from one microorganism to another. The UV dose is the fundamental parameter to properly size a UV system. It corresponds to the product of UV light intensity (irradiance) and exposure time, which directly depends on the water flow.

The graph below shows the effectiveness of different UV systems depending on the water flow. The data are collected 2h after treatment using the ATP tests DENDRIDIAG SW. The graph highlights the effect of the water flow on UV disinfection efficiency. 

According to many studies on the subject, the minimal UV dose is 40 mJ/cm² to inactivate all microorganisms.  Usually, UV-C are used at a wavelength of 254nm.

However, several parameters have an impact on UV disinfection efficiency:

  • water clarity,
  • turbidity,
  • total suspended solids,
  • colour,
  • dirtiness of the lamps (scaling, high iron or manganese content in water…),
  • water film thickness,
  • aging of lamps…

Unlike biocidal treatment such as chlorination, UV radiations have no residual disinfection. If the nucleic acids show little damage, microorganisms have the ability to repair their genetic material and can grow again. This phenomenon is known as reactivation. Therefore, water disinfected by UV light should not be stored, at the risk of further proliferation. UV disinfection is particularly efficient and relevant when used:

  • at the point of use,
  • in addition with other treatements,
  • on clear water poorly contaminated.

UV treatment efficiency assessed by ATP testing

Quantitative ATP tests measure the amount of ATP in microorganisms. It measures the total flora after UV disinfection, there are 3 main scenarios:

  • Immediate decrease: the UV system has an immediate bactericidal effect that destroys the cells. The ATP is freed in the water. The membrane filtration step of the ATP test eliminates the free ATP.
  • Decrease after a two-hour delay: the UV system efficiently damaged the cells, but did not alter the membrane integrity. Therefore, this time, the filtration step does not eliminate these damaged cells. After 2 hours, the cells will be destroyed and the bactericide effect will be visible by ATP testing.
  • No decrease observed 2h after treatment: the UV system has little to no bactericidal effect. It is then important to assess whether the UV system has a bacteriostatic effect. Indeed, the risk of reactivation and regrowth is high. If the bacteriostatic effect is shown, it is then possible to use the treated water quickly, without storage.
How to assess the bacteriostatic effect of the UV disinfection?

Following UV disinfection, sample one litre of water. Using ATP test, measure the sample 2 hours after treatment, then every 24h for 3 to 4 days. This study will show you the biomass evolution in time, such as depicted in the following graph.

Keep in mind that, by culture method, this bacteriostatic effect can be mistaken with a bactericidal effect. Indeed, the inactivation leads to an increase of the latent period and thus to a decrease or absence of colony.

If the UV disinfection is not satisfactory, various options should be considered:

  • Increase the lamp intensity,
  • Decrease the water flow,
  • Check the lamp state and the quartz scaling
  • Check the water clarity…

Total biomass evolution after UV disinfection

Why, when and how check for somatic and RNA F-specific coliphages?

Viral indicators, parameter now included in regulations

The European regulation recently added the monitoring of coliphages to control the quality of drinking water and reuse water.

For the monitoring of drinking water, the EU Directive 2020/2184 requires the detection of somatic coliphages only. It is the first time that a viral parameter has been introduced in the field of tap water. They must be checked for in raw water. If the result is above 50 PFU per 100 ml, then, the water after treatment must be analysed.

Regarding water reuse system, total coliphages must be enumerated, i.e. somatic coliphages and RNA F-specific coliphages (Regulation (EU) 2020/741). This parameter is now required for the reuse of reclaimed water for irrigation of all food crops consumed raw where the edible part is in direct contact with reclaimed water and root crops consumed raw.

The enumeration of somatic and RNA F-specific coliphages is used to qualify the efficacy of drinking water and wastewater treatment plants.

See this article form more information on somatic coliphages.

 Indicators in the fight against covid-19

In the fight against SARS-CoV-2, ANSES was charged to evaluate two viruses, somatic and RNA F-specific coliphages, to monitor the reduction of SARS-CoV-2 in wastewater and sludges¹.

Reference values:
Regulation Application field Virus Reference value
Before treatment
Reference value
After treatment
Directive EU 2020/2184 Water intended for human consumption Somatic coliphages < 50 PFU/ 100 ml 0 / 100 ml
Regulation EU 2020/741 Reused water for agricultural irrigation Total coliphages* 6 LOG10 reduction**

The performance targets established by the regulations ask that a sample concentration method is used in analytical laboratories.

*If analysis of total coliphages is not feasible, at least one of them (F-specific or somatic coliphages) shall be analysed.
** If a biological indicator is not present in sufficient quantity in raw waste water to achieve the log10 reduction, the absence of such biological indicator in reclaimed water shall mean that the validation requirements are complied with.

What standards should you use for the analysis

Standards ISO 10705-1 and 10705-2 describe the detection method of RNA F-specific coliphages and somatic coliphages respectively. The enumeration is done using a double agar layer plaque assay. With this method, up to 5 ml of sample can be analysed on the same petri dish. Thus, if 20 plates are inoculated in parallel, this procedure will allow detection of one virus in 100 ml. However, this method is extremely time and effort consuming, as well as costly. Therefore, it cannot be used as a routine method.

Standard 10705-3 recommends several concentration methods, detailed below. Each laboratory must implement and validate its procedure based on the performance criteria described in the standard.

Concentration methods of ISO 10705-3

Méthode Principle Benefits Flaws
Adsorption/ elution 

Adsorption of virus on a filter by electrostatic interactions.

Elution in 10-15 ml or 500-1000 ml then reconcentration by ultrafiltration.

Recommended for large samples (10 to 100 litres).

  • Easy
  • High yields
  • High investment costs
  • Expensive consumables
  • Clogging
  • Low reproducibility
Flocculation

Flocculation of viruses with Mg(OH)2.

Elution in 30 ml.

Recommended for samples ranging from 100 ml to 1 l with turbidity > 2 NTU.

  • Cheap
  • Efficient for turbid samples
  • Labour intensive
  • Use of chemical components
  • Low reproducibility
Membrane filtration

Concentration of viruses on a filter.

Elution in a small volume <5ml.

Recommended for samples ranging from 100 ml to 1 l with turbidity < 2 NTU.

  • Low labour costs
  • Easy
  • Reproducible
  • Yields impacted by the filtration flowrate
  • Few references available

Membrane filtration is perfectly adapted for treated water (drinking and reclaimed water). Indeed, concentration of 100 ml to 1 litre of sample is enough to meet the performances required. Besides, the treatment generally guarantees a high quality water with low total suspended solids and low turbidity, which enable the filtration of one litre of water without clogging issues.

Therefore, membrane filtration is the best compromise possible, offering simplicity, rapidity and performances.

Membrane filtration: VIRAPREP®

This method is a simple membrane concentration of samples ranging from 100 ml to 1 litre on a specific filter that has an affinity for the concerned viruses. They are then eluted in a solution that guarantees their integrity and infectivity. The elution volume (5 ml) and the membrane filter are inoculated on a double layer agar (10705-1 and -2) in order to analyse the whole sample.

The VIRAPREP® kit, that GL BIOCONTROL produces, is a turnkey solution to concentrate somatic and F-specific RNA coliphages. This kit, fully compliant with the ISO 10705-3 requirements, limits the analysis to the inoculation of two to three petri dishes.

Several analysis laboratories were accredited by the French Accreditation Committee (COFRAC) using VIRAPREP® as their concentration method.

Who are the coliphages, new parameter of the Drinking Water Directive?

Coliphages are viruses able to infect coliform bacteria such as Escherichia coli or less frequently Shigella spp or Klebsiella spp.
E. coli is the most abundant bacteria in the lower intestine of humans and animals. Therefore, coliphages, which are non-pathogenic viruses, are the most common in the intestine.
Besides, it has been shown that coliphages do not replicate in the environment because of unfavourable conditions. Thus, coliphages found in the environment mainly come from faecal contaminations and can be used as an indicator of water microbiological quality.

Main characteristics of coliphages

In water, we mainly focus on two kinds of coliphages: somatic coliphages and F-specific RNA bacteriophages.

Somatic coliphages F-specific RNA bacteriophages
Infection method Through the cell wall Through fertility (F) pili
Size Variable (≈ 50-120 nm) 21-30 nm
Genome Single or double-stranded DNA Single-stranded RNA
Most known family Myoviridae, Podoviridae or Microviridae Leviviridae
Most used surrogate ϕX174 MS2

The term « total coliphages », that we can find in some regulations, means both somatic coliphages and F-specific RNA bacteriophages. 

What is the best indicator of faecal contamination / treatment efficiency?

Are somatic coliphages a better indicator of faecal contamination than F-specific RNA bacteriophages?

It is a matter of debate. Scientific studies appear to show that somatic coliphages are generally more abundant in water than F-specific RNA bacteriophages. However, the opposite seems to be true in ground water or in recycled water treated with UV light. Besides, from a purely technical point of view, enumeration of somatic coliphages is much easier.

What is certain is that in comparison with bacterial indicators, coliphages are less sensitive to disinfection processes and survive longer in the environment. Furthermore, viruses migrate farther and faster in soils than bacteria. Thus, water can be contaminated with human enteric viruses, even in the absence of traditional bacterial indicators (coliforms, E. coli). The report from French Agency for Food, Environmental and Occupational Health & Safety (ANSES, n° 2018-SA-0027), published in 2018, points out that bacteriophages are excellent indicators of treatment efficacy against viruses.

What are the regulations?

For some years now, many regulations around the world have introduced the analysis of coliphages to monitor the water quality (e.g. Australia, Europe, some states of the USA…). These new microbiological criteria concern the water intended for human consumption as well as treated wastewater. The existing regulations recommends analysing either somatic coliphages or F-specific RNA bacteriophages, or both.

In Europe, the enumeration of somatic coliphages is introduced in the new EU Drinking Water directive 2020/2184. They must be checked for in raw water. If the result is above 50 PFU per 100 ml, then, the water after treatment must be analysed.

Furthermore, this new directive introduces Water Safety Plans (WSPs). These management plans require the implementation of a new global strategy of risk prevention. Therefore, managers must have new indicators, such as somatic coliphages. This revision was published on December 23th, 2020.

Enumeration of coliphages is also required by the EU regulation on minimum requirements for water reuse published in June 2020. In this case, total coliphages should be analysed in the intake and output water of the treatment plant. A 6-log reduction is required for water intended for agricultural irrigation.

How to detect coliphages?

To meet these new regulatory requirements, laboratories must implement suitable analytical methods. Based on the ANSES report, in 2018 in France, only one laboratory was accredited for coliphage analysis, and only for F-specific RNA bacteriophages.

EN ISO 10705-1 and 10705-2 set out the method to enumerate respectively F-specific RNA bacteriophages and somatic coliphages using double agar layer.

However, these Standards only offer to inoculate 5 ml of water on 20 different petri dishes to analyse 100 ml samples. This method is extremely time and effort consuming, as well as costly. Therefore, it cannot be used as a routine method.

However, part 3 of this standard recommends a few solutions. Based on several studies, concentration on membrane filter is the easiest and cheapest to implement. It is particularly well adapted to observe the 4 to 6 LOG reductions required for the analysis of low turbidity water such as drinking water or reuse water.

This is why GL BIOCONTROL offers the concentration kit VIRAPREP® already used by several analysis laboratories. 

ATP testing: A predictive indicator of bacteriological non-compliance in water

HPC (Heterophoric Plate Count) culture mediums such as YEA, PCA or R2A, frequently used for environmental bacteria counting, detect less than 1% of the total flora (WHO, 2003). Indeed, a large proportion of bacteria cannot multiply on those mediums. For example, there are:

  • Anaerobic organisms (tolerant or obligate): oxygen presence slows down or inhibits their growth.
  • Bacteria requiring a specific temperature to grow such as psychrophile (low temperature) or thermophile (high temperature).
  • Germs requiring a specific environment such as acidophiles (high acidic conditions) or halophiles (high salinity).
  • Germs requiring specific elements such as rare amino acids, complex sugars, vitamins, cations…
  • Non-culturable bacteria whose culture is impossible using traditional methods.
Total bacterial flora

Diagram of total bacterial flora

  • VBNC bacteria (viable but non-culturable) which have momentarily lost their growing capacities as a response to stress. The use of biocides, physical treatments (ex: UV) or the environmental parameter modifications (temperature, pH…) can cause that change of state.

Furthermore, the bacteria needs to form a colony to be detected by the technicians’ eye. Which means growing from one to several billions within the allocated time period. That implies a short lag phase and a fast growth. Those parameters partly depend on the incubating temperature and the type of medium used.


In the end, we only detect aerobic mesophilic flora able to grow between 20°C (68°F) and 45°C (113°F) in the given time and for which the nutrients are adequate.
Why you should not speak of “total flora” with culture method?

Each culture medium will only detect a part of the bacteria depending on chosen conditions.
Thus, to be thorough, we should speak of “culturable flora” indicating the medium, temperature and incubation time chosen.

Diagram ATP vs cultural method

Example of bacterial growth monitored by culture and ATP-metry

As for ATP testing, it detects the whole living bacterial flora, even non culturable bacteria. For all these reasons, it is often observed an increase of total flora by ATP testing long before the appearance of the first colonies on the culture medium.

ATP-metry is an early indicator of microbiological contamination.

How to reduce non-quality costs in the electroplating industry?

HOW TO REDUCE NON-QUALITY COSTS IN THE ELECTROPLATING INDUSTRY?

Microorganism development in rinsing baths in the electroplating industry can cause visual defects on the treated items. This kind of contamination can lead to substantial non-quality costs and production shutdowns.

To this day, few water system operators implemented monitoring procedures of the microbial development. Preventive measures are done “blind” at a frequency arbitrarily defined and without concrete follow-up. To address this contamination issue, GL BIOCONTROL developed a three-step systematic approach. It has been tested in several watchmaking factories, and companies specialized in surface treatments. Feedback on an innovative process.

Microbial contamination remains poorly known by operators

When a new production unit is installed, the water system is generally properly thought: the water pipes are new and clean with smooth surfaces, and maintenance procedures are well defined. All the ingredients required to ensure a high-quality production.

However, over time, we often observe drifts in the system. Several problems can appear:

  • Modifications of the water system leading to dead legs.
  • Selection of a few bacteria due to repeated treatment. Indeed, common prevention mainly relies on biocides such as isothiazolone, only biocide compatible with the surface treatment processes. Over time, this treatment can lead to the selection of a resistant flora.
  • A cleaning and disinfection strategy not adapted to the water system. A too short contact time and/or a weak biocide concentration lead to ineffective biocide treatments.
  • Appearance of corroded spots or scaled areas in the pipes and baths. This induces microorganism adhesion and biofilm formation.
  • A high turbidity, often due to a closed loop water recycling system, that limits UV efficiency.

All these parameters lead to microbiological development in the water system and in the rinsing baths.

This microbial contamination has a negative impact on the quality of the treated items. Besides, the facility’s manager suffers a dual financial penalty: costs related to production defects (batch recalls…) and costs induced by production shutdowns to clean and disinfect the unit. Without mentioning the negative effect on the brand image…

The need of the electroplating sector is dual: ensuring the good microbiological quality of the treatment baths while limiting the maintenance costs.

A three-step approach

At GL Biocontrol, we developed a systematic approach in order to secure the manufacturing process. This solution, organised in three stages, answers to the industrial needs and optimises the corrective actions.

Identify…

The first step aims to map the water circuits in order to identify in real-time the areas under control and the critical areas. This thorough inspection highlights the circuit’s components producing biomass. To be as responsive as possible, we use a measuring tool that gives you the result directly on the field: quantitative ATPmetry. The delay, inherent to the cultural methods, is thus avoided. The production water system, the treatment baths as well as the surfaces must be analysed.

Mapping detects the critical areas of the circuit. Since then, the operator can implement the correctives actions to improve the microbiological quality of the process.

…Assess…

Next, these corrective actions must be monitored over time and assessed. For example, the various stages a treatment procedure (cleaning and disinfection) are assessed and optimised in real-time. The goal of this second step is to adjust the treatment to the ecosystem encountered to ensure an optimal efficacy. In this way, we durably limit microbial growth and biofilm formation.

…Monitor

Finally, the third and last step aims to monitor over time the evolution of the production unit microbiological quality. Using ATP tests, one can self-monitor its water circuits, the electroplating and rinsing baths. Service technicians can perform themselves the sampling and analysis on a regular basis. Implementing a biomonitoring will allow you to control in real-time the microbiological activity of the circuits. In this way, it is possible to react immediately in case of a significant increase of the microorganism level. The operator starts the earlier corrective actions to limit non-conformity on the treated parts. Besides, using an indicator of biocontamination will allow you to trigger the cleaning and disinfection procedures only when needed.

Personalized support and follow-up

GL Biocontrol offers a complete provision of expertise of the water systems and treatment baths. We also supply you with all the reagents, consumables and measurement device required for monitoring the microbial quality.
Furthermore, the offer comprises a personalized support covered by our experts to ensure that it is properly implemented: handling of the ATP tests, definition of the surveillance limits, determination of the corrective actions, etc…

To sum up…

The DIADEM approach has many advantages for production units in the sector of surface treatments. Optimisation of the microbial quality of the water and baths, as well as the implementation of a self-monitoring by ATPmetry will allow you to:

  • Reduce production costs (avoid production shutdown, limit volumes of treatment products used, reduce the C.I.P procedures)
  • Reduce non-quality costs due to visual defects on the treated items.  

For more information :

CONTACT US

Research project: development of a detection kit for somatic coliphages

By Estelle Alaume

In Europe, water intended for human consumption is highly regulated by the Drinking Water Directive. Water intended for human consumption includes distribution systems, drinking water in bottles or containers and water used in the food-processing industry. Recently, the revision of the Drinking Water Directive (n°98/83/CE) adds new parameters to the list of criteria determining water safety, such as control of somatic coliphages. These viruses are used as indicator organisms for faecal contamination. Its control represents an important step towards a high quality of drinking water.

Somatic coliphages, new faecal contamination indicatorContinue Reading